

Short answer: gputaskman vs nvidia-smi is the split between a device meter and a process view that can name weights vs KV cache. Use gputaskman when Windows WDDM or WSL makes nvidia-smi print N/A or an empty process list.
The question is which program is filling a graphics card. A graphics card (the board that draws the screen and also runs a lot of local AI) reports one fat number, and that number does not say who is holding the bytes. This week Scott Hanselman published gputaskman, a terminal GPU task manager, MIT licensed, latest release tag v0.3.3 checked against the repo on 9 November 2026. He posted the repo on 3 November. This write-up could not watch it live on this machine. nvidia-smi is not installed here, and the machine has no VGA or 3D device, so there is no card to sample. Instead, this write-up reads the README and the project’s own screenshots of an NVIDIA GeForce RTX 4080 SUPER. Those captures are labeled as real local workloads, not mock data.
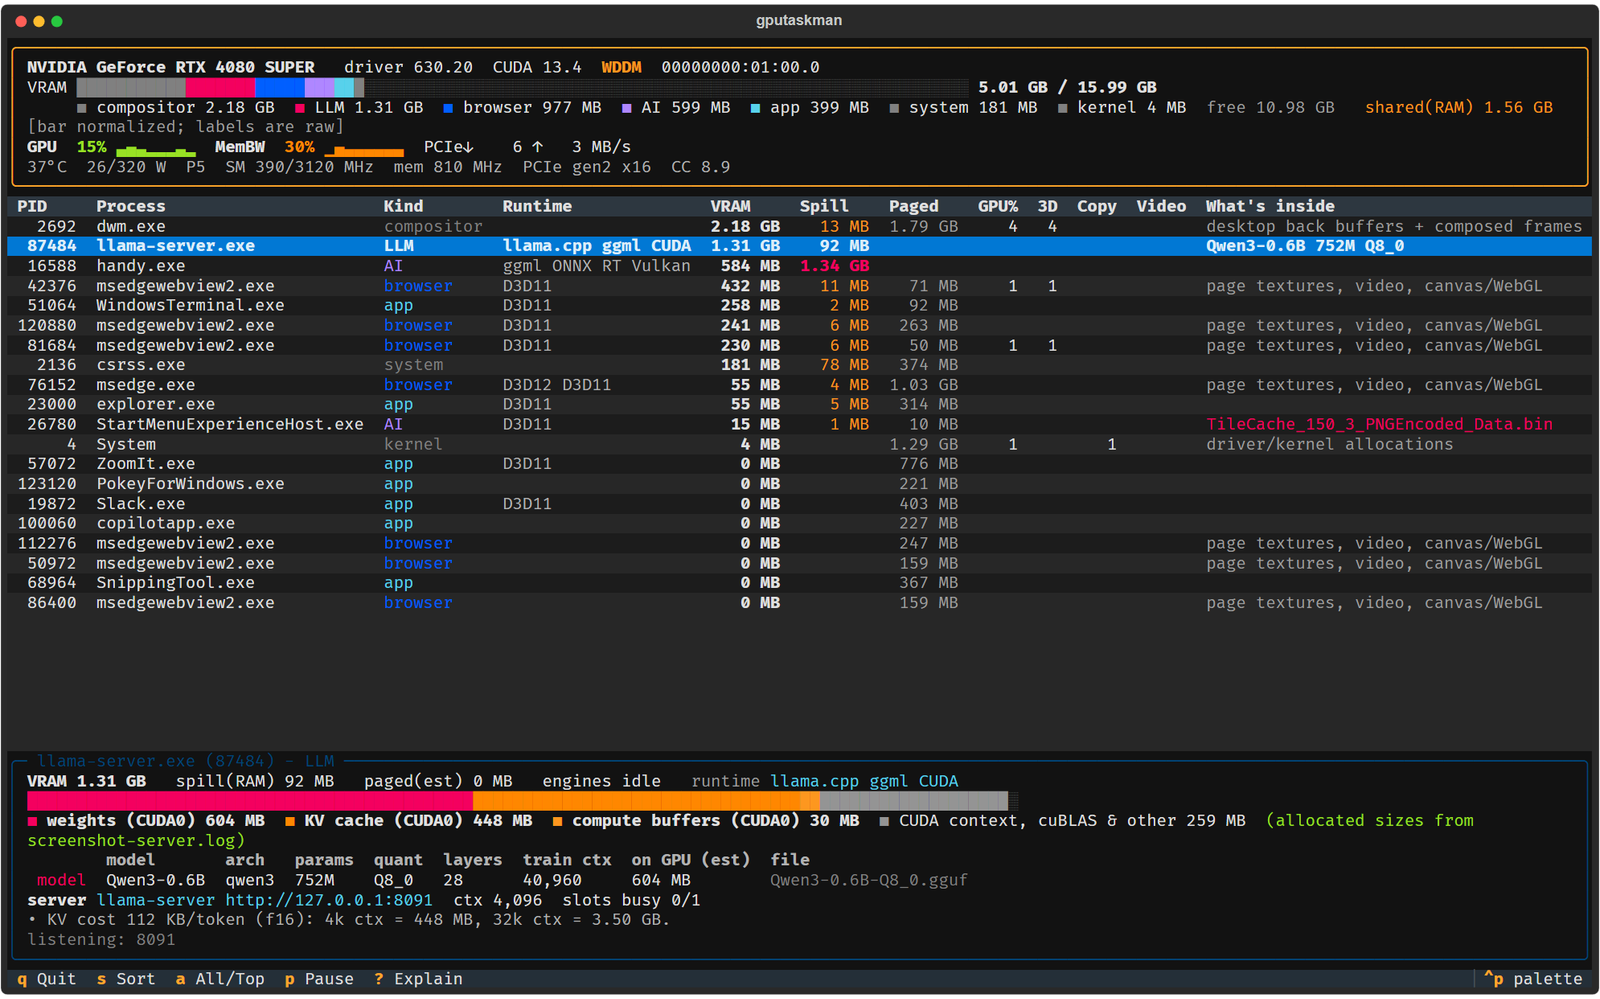
The number that is worth keeping: a small local model, Qwen3-0.6B at Q8_0, is using 1.31 GB of VRAM, and 448 MB of that is the KV cache for only 4,096 tokens of context. The same panel says 32,768 tokens would be 3.50 GB of cache. The desktop compositor, dwm.exe, is using more VRAM than the model: 2.18 GB.
gputaskman is worth it when you already run a local model on Windows or Linux and Task Manager or nvidia-smi only tells you that the card is full. Related reading: Uncut vs Claude Code. It is not worth installing on a machine with no GPU, and it will not name the textures inside a game.
What the Card Is Actually Holding
A GPU (graphics processing unit, the chip that does the drawing and a lot of the model math) sits on a board next to its own memory chips. That memory is VRAM (video RAM, memory on the card, separate from the RAM your ordinary programs use). A process (one running program, with its own process id) can own some of that VRAM. A model weight (one learned number inside the model) lives in a file until a runtime copies it onto the card. Context (how much of the conversation the model is allowed to look at, counted in tokens) is not the same as the weights. A token (a chunk of text, often a word or part of a word) is the unit the cache grows by.
On the capture, the device line is concrete. NVIDIA GeForce RTX 4080 SUPER, driver 630.20, CUDA 13.4, and the word WDDM. WDDM (Windows Display Driver Model, the Windows driver path that owns GPU memory) is why the next section matters. The bar says 5.01 GB used of 15.99 GB, with 10.98 GB free, plus 1.56 GB of shared RAM. The card is at 37 C, drawing 26 W of a 320 W limit, GPU activity 15 percent, memory bandwidth 30 percent.
The colored labels under the bar are raw, and the bar itself is normalized. The screenshot prints that. Adding the labels does not equal 5.01 GB:
The tool’s own note on dwm.exe says per-process samples can overlap or differ in timing. Do not add the rows and expect the device total. If a blog post does that, it is wrong even when every row is copied correctly.
Why nvidia-smi and Task Manager Stop Early
nvidia-smi (NVIDIA’s command-line tool that ships with the driver) is a device meter plus, on Linux, a process list. It can tell you the card name, the temperature, the power, and often which process id holds how many MiB. It does not open the model file and split those MiB into weights, KV cache, and scratch space.
The README states two holes that match how people actually run local models. On GeForce under WDDM, Windows manages GPU memory and NVML (NVIDIA’s management library, the thing nvidia-smi talks to) may report per-process memory as N/A. Under WSL (Windows Subsystem for Linux, a Linux environment inside Windows), nvidia-smi lists no processes at all. Windows counters can still attribute memory across Direct3D, Vulkan, OpenGL, and CUDA. gputaskman reads those counters for the per-process rows, and it still uses NVML for the device totals.
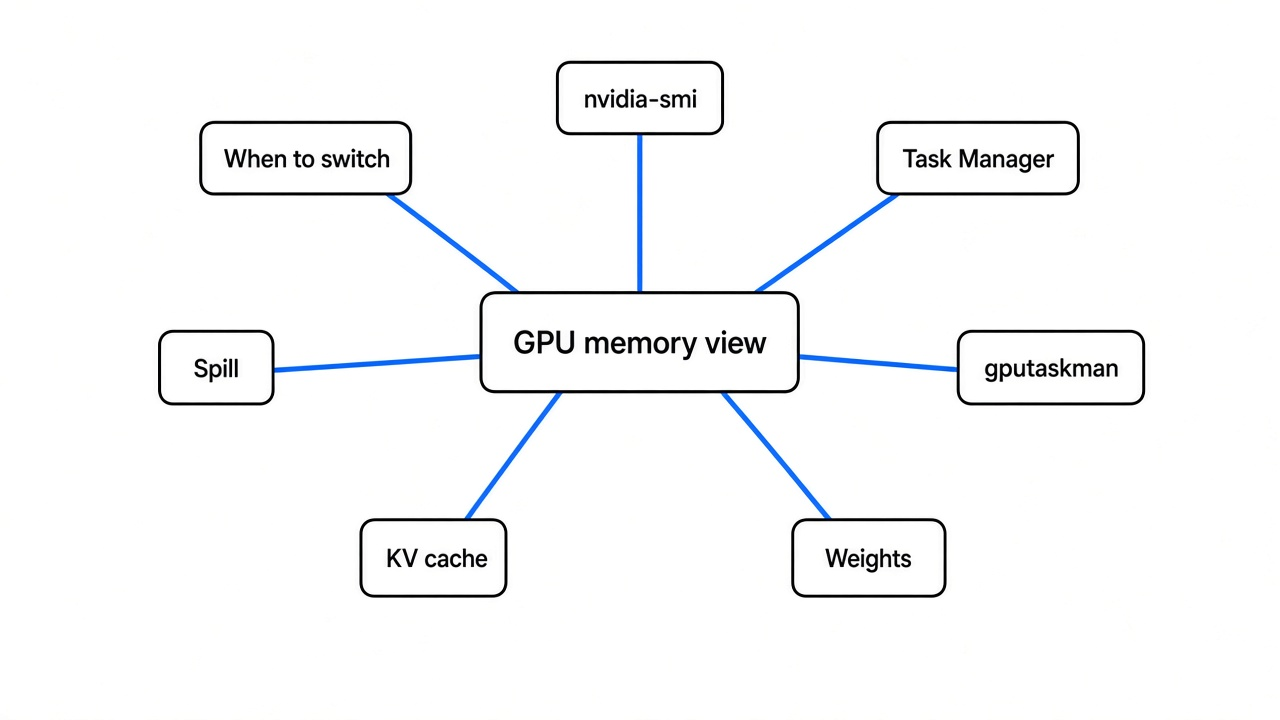
That picture is an illustration of Task Manager’s GPU page, not a measurement from the 4080 SUPER capture. The point of the picture is the split it does show: dedicated GPU memory versus shared GPU memory. Dedicated means on the card. Shared means the GPU is allowed to use ordinary RAM. Task Manager still will not tell you that 448 MB of the dedicated number is a cache of past tokens.
| Question | nvidia-smi | Task Manager | gputaskman |
|---|---|---|---|
| How full is the card? | Yes, on NVIDIA | Yes | Yes |
| Which process? | Often, on Linux NVIDIA. Often N/A per process on Windows WDDM. No processes under WSL | Yes, but shared surfaces get counted in more than one place | Yes, from WDDM counters on Windows, including CUDA |
| Weights vs KV cache vs compute buffers? | No | No | Yes, for GGUF / llama.cpp style runtimes, from the file header, logs, and the local API |
| Spill into system RAM? | Not as a per-process spill column | Shared GPU memory, as a total | A Spill column, and it says spill is GPU-accessible RAM, not proof the card overflowed |
| Game texture names? | No | No | No. The help screen says that needs a debugger such as PIX or Nsight |
Hanselman calls gputaskman an htop for what is inside the GPU, not just how full it is. htop (an interactive process viewer) did this for CPU and RAM years ago. The GPU version is harder because the card’s memory is not a normal process list, and because a model file mapped into a process is not the same as bytes resident on the GPU.
What a KV Cache Is
A transformer (the kind of model that writes the next token by looking at the tokens it has already seen) does a step called attention (a weighted look at earlier tokens). For each token it builds a query, a key, and a value. The query is “what am I looking for right now.” The keys and values are “what the earlier tokens offered.” Those keys and values do not change once the token is written, because the weights are frozen. Recomputing them on every new token is wasted work. The KV cache (the stored keys and values for tokens already seen) is that shortcut. It grows with context. It is not the model file.
The capture makes the size obvious, and the arithmetic is checkable.
The selected process is llama-server.exe, pid 87484. Runtime: llama.cpp, ggml, CUDA. VRAM 1.31 GB. Spill 92 MB. Inside that 1.31 GB, the log-backed split is:
The model row says Qwen3-0.6B, architecture qwen3, 752M parameters, quantization Q8_0, 28 layers, training context 40,960, file Qwen3-0.6B-Q8_0.gguf, estimated 604 MB on GPU. Quantization (storing each weight in fewer bits) is why a 752M model is not a 1.5 GB fp16 file. Q8_0 is an 8-bit format. The “0.6B” in the name is a rounded parameter count. The panel’s precise count is 752M. A parameter (one stored number the model learned) is not a token.
The panel also prints the rate it used: KV cost 112 KB per token at f16 (16-bit floats, two bytes per number). Check it:
That 448 MB is the orange bar. The server line says context 4,096 and slots busy 0/1, at http://127.0.0.1:8091. So the cache is already reserved for a context the model is not even filling. Busy 0 of 1 means nobody is mid-reply. The cache cost is the context limit, not the length of the sentence you just typed, until the runtime allocates lazily. More on that below.
A 0.6B model whose weights are 604 MB can still want 3.50 GB of cache if you turn context up to 32k. That same VRAM math shows up when you ask can I run a 125B model on a 12GB GPU. The card in the capture has 15.99 GB, so it would fit. An 8 GB card with a bigger model would not. That is the practical reason to look at the split before you raise the context flag.
Not every model file has a KV cache. The README says a non-causal encoder (a model that labels or embeds a whole input, instead of writing the next token) allocates none, so none is estimated. The tool reads kind from GGUF header keys. A causal model with layers and a trained context is treated as an LLM (large language model, the next-token kind). A decision model (a small model that picks a label) is a different kind. A mapped filename alone is not proof of which kind is on the GPU.
What Is Measured and What Is Guessed
Pressing ? in the UI opens a table titled “What can be known about GPU memory?” The rows below are copied from that overlay, because this is the part most write-ups skip.
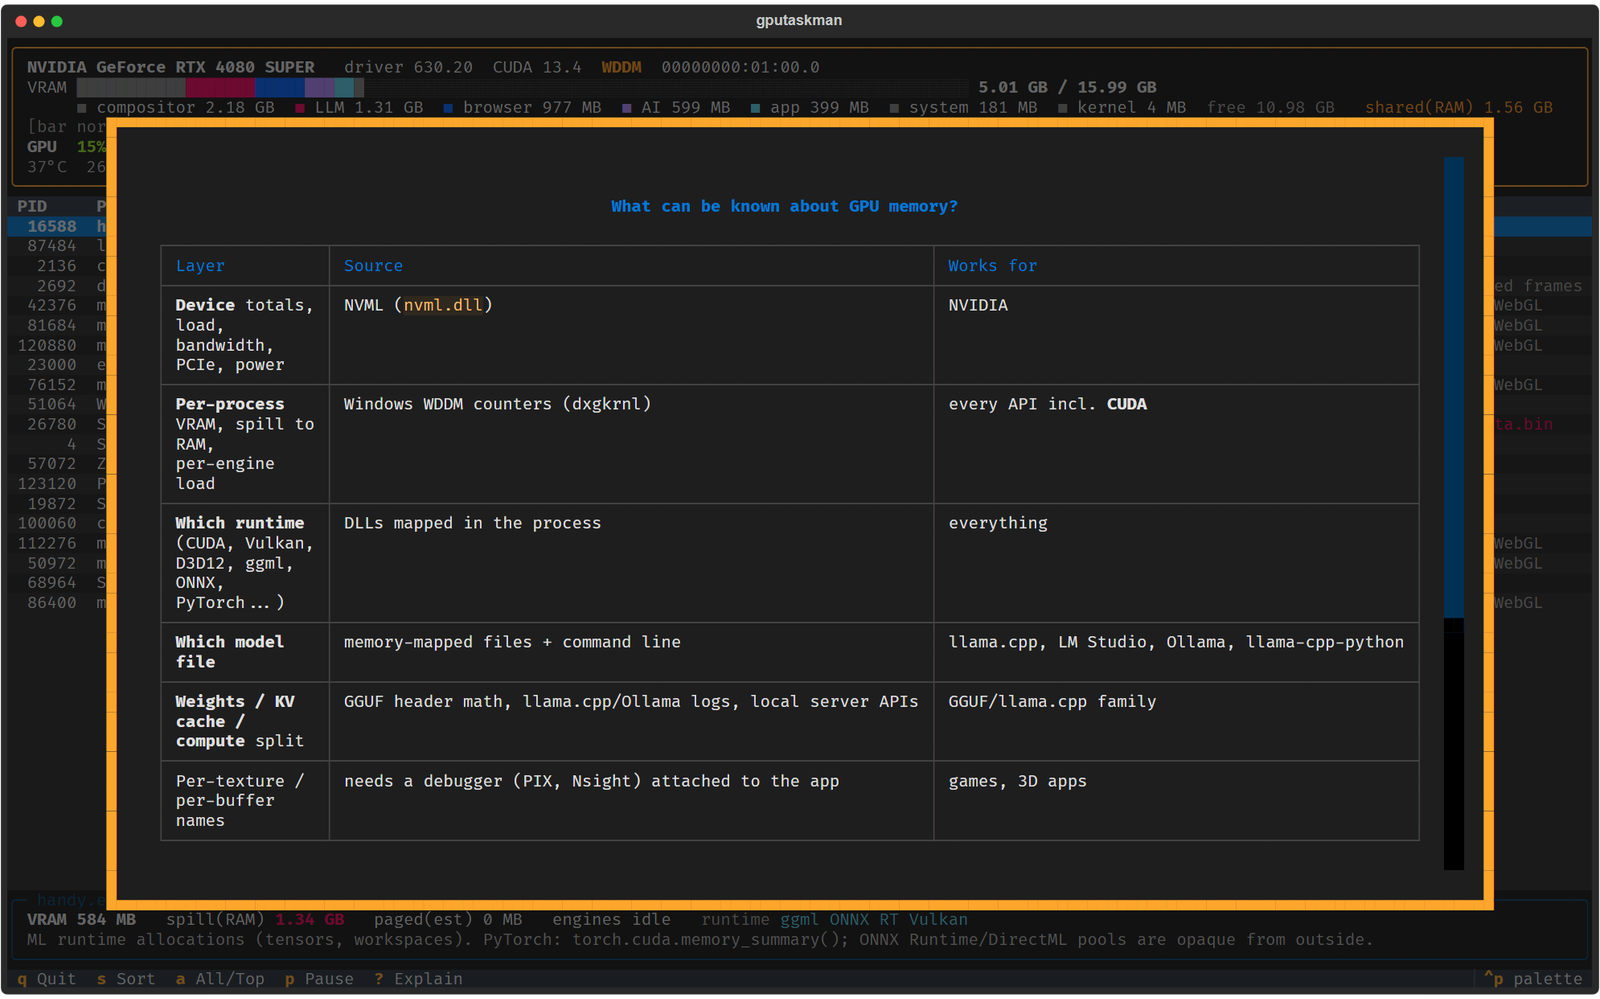
| Layer | Source | Works for |
|---|---|---|
| Device totals, load, bandwidth, PCIe, power | NVML (nvml.dll) | NVIDIA |
| Per-process VRAM, spill to RAM, per-engine load | Windows WDDM counters (dxgkrnl) | every API, including CUDA |
| Which runtime | DLLs mapped in the process | everything |
| Which model file | memory-mapped files plus the command line | llama.cpp, LM Studio, Ollama, llama-cpp-python |
| Weights / KV cache / compute split | GGUF header math, llama.cpp or Ollama logs, local server APIs | GGUF / llama.cpp family |
| Per-texture or per-buffer names | needs a debugger (PIX, Nsight) attached to the app | games, 3D apps |
Evidence is ranked. api means the runtime’s local API says the model is loaded. mapped means Windows shows the file mapped into the process now. cmdline means the file was a launch argument. installed means the file is in the app folder, which proves nothing about what is loaded. Two sources, and one of them must be api or mapped, show as confirmed. A DLL that says PyTorch or CUDA only identifies a runtime. It does not identify a model, and it does not prove training.
The weights, KV, and compute numbers on the Qwen row are labeled as allocated sizes from screenshot-server.log. The “on GPU (est)” column is the header estimate. On this particular capture they agree at 604 MB and 448 MB. They do not always agree. That is the next section.
Why the Desktop Is Bigger Than the Model
dwm.exe is the Desktop Window Manager (the Windows process that composites each window into the picture on the monitor). On the capture it is kind compositor, 2.18 GB of VRAM, only 13 MB of spill, and an estimated 1.79 GB paged. The detail pane says 1.79 GB of 3.98 GB committed is not accounted for by local or non-local usage, and that this is estimated non-residency, not proof of eviction or disk paging. Paged here is an estimate: committed memory minus local minus non-local, floored at zero. It is not a measurement that Windows swapped those bytes to disk.
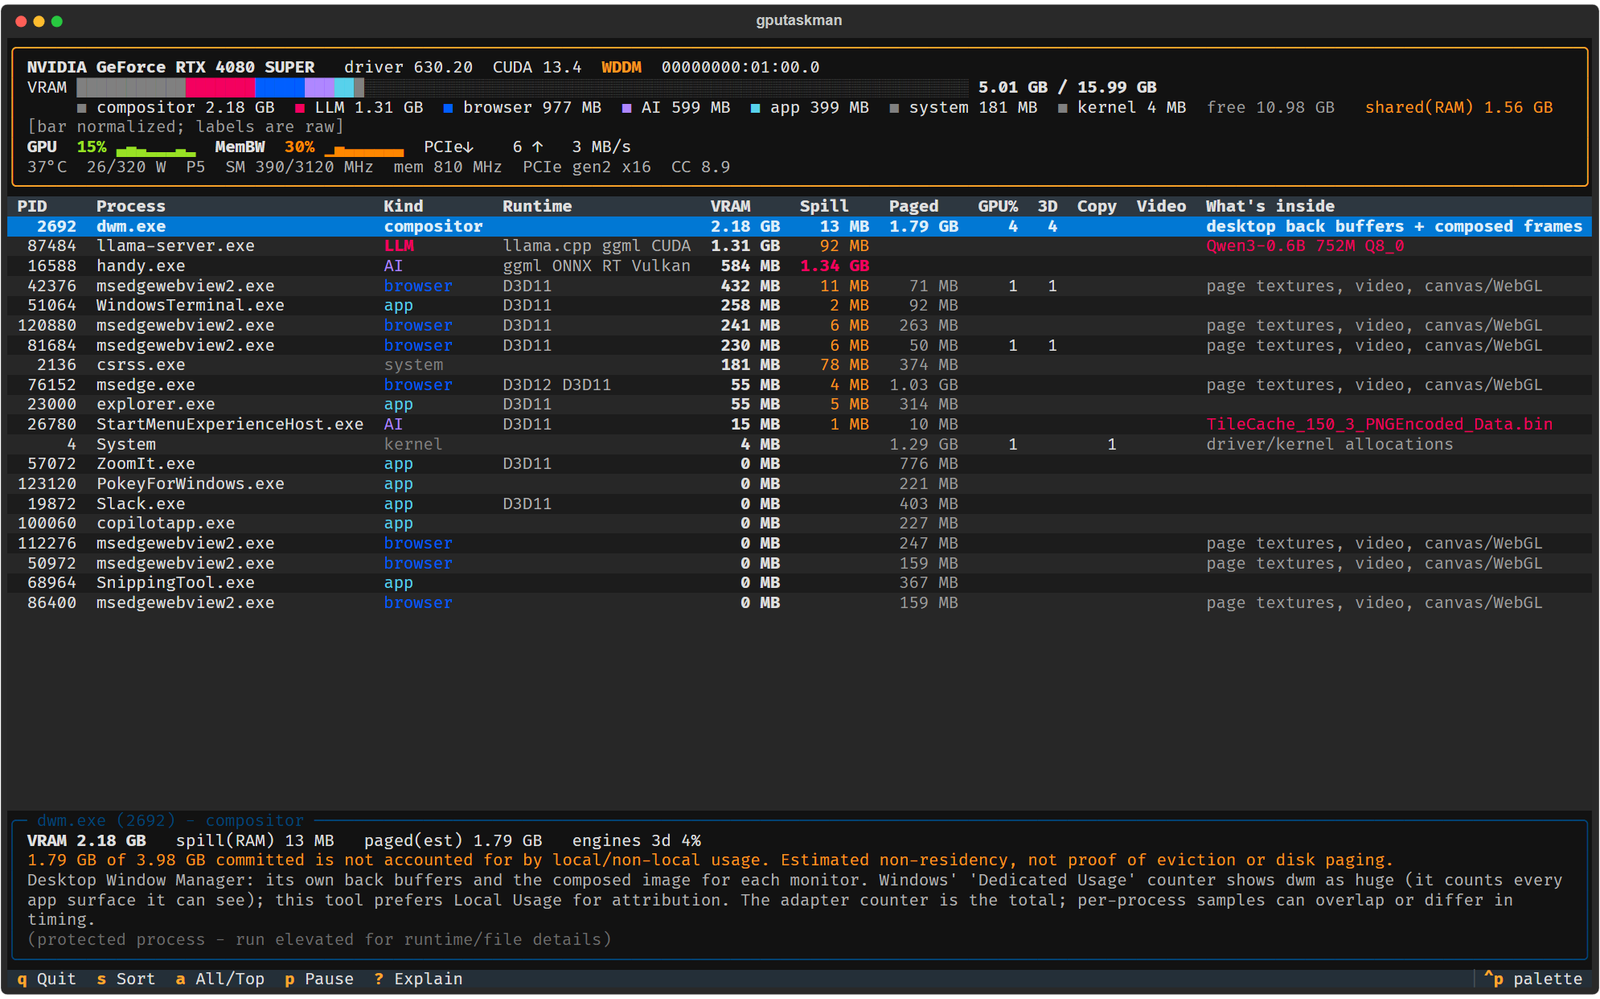
The same pane says Windows’ Dedicated Usage counter shows dwm as huge because it counts every app surface the compositor can see. gputaskman prefers Local Usage for attribution. If Task Manager makes you think the desktop is a 4 GB model, you are looking at the counter that double-counts windows. The model in the row below is 1.31 GB. The browser rows are hundreds of megabytes each, kind browser, runtime D3D11, and the “what’s inside” column says page textures, video, and canvas or WebGL. Edge is not free just because you opened it to read docs while a model loads.
What Spill Means
Spill, in this tool, is GPU-accessible system RAM. The GPU can use ordinary memory, but that does not prove the card ran out and evicted something. Sort by the Spill column and handy.exe jumps to the top: 584 MB of VRAM and 1.34 GB of spill. Kind AI. Runtime ggml, ONNX Runtime, Vulkan. The pane says these are ML runtime allocations, tensors and workspaces, and that ONNX Runtime and DirectML pools are opaque from outside. You can see the size. You cannot see the tensor names. For PyTorch, the README points you at torch.cuda.memory_summary() if you need the inside of that pool.
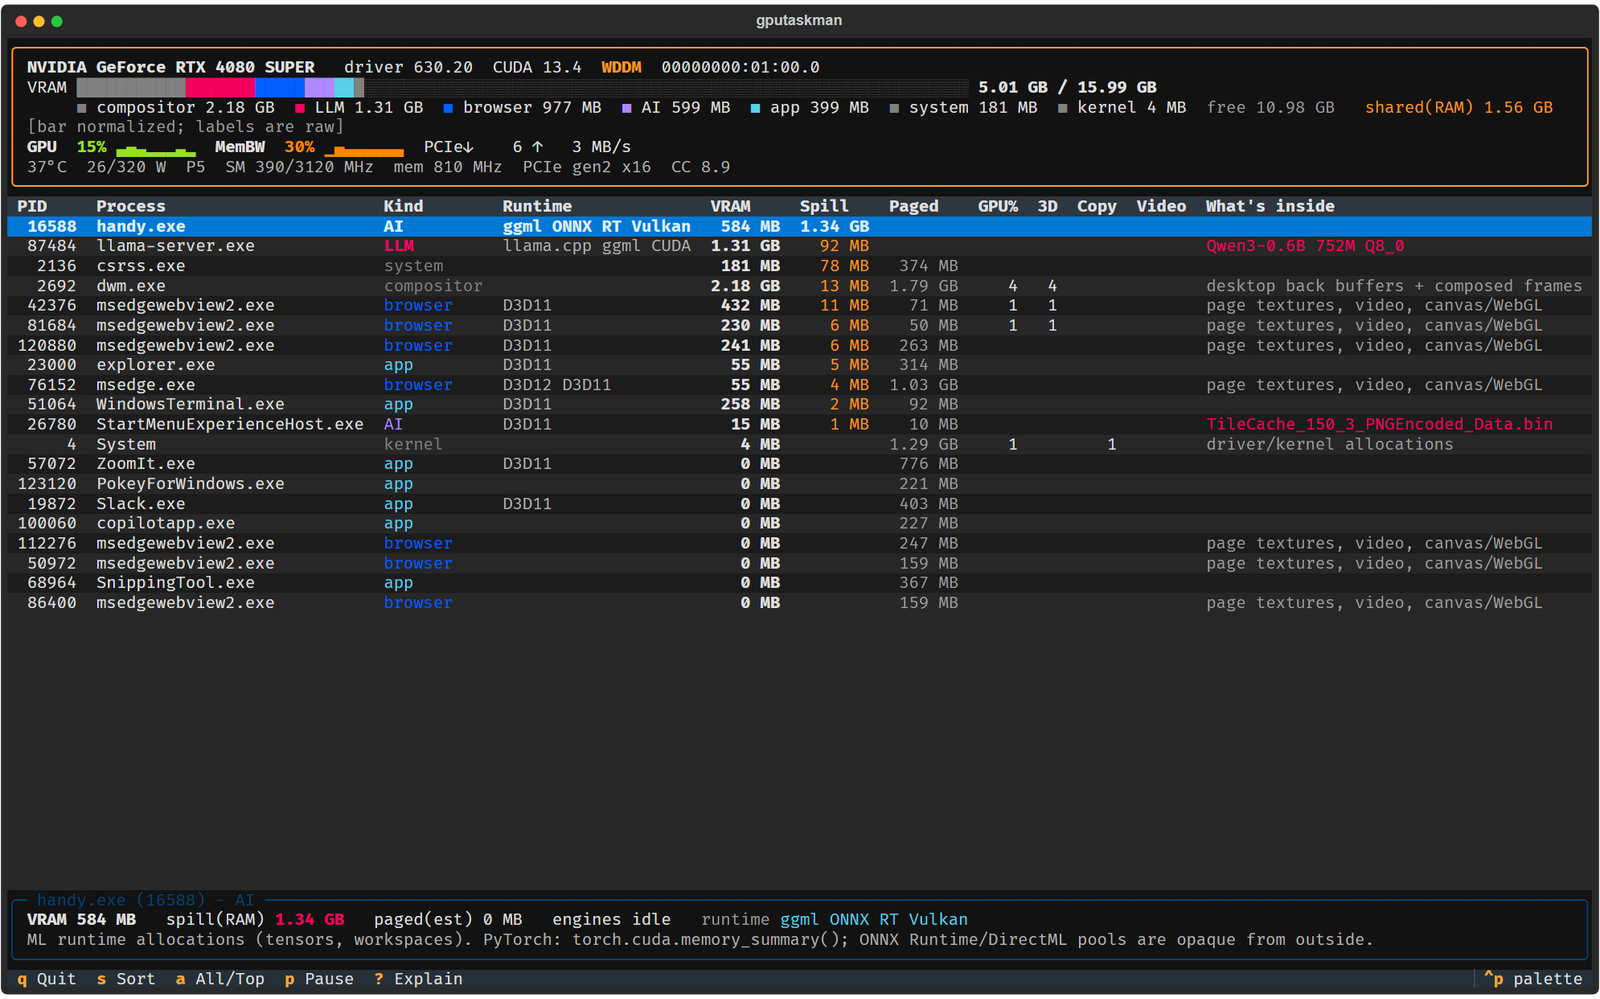
llama-server.exe on the same screen has only 92 MB of spill against 1.31 GB of VRAM. The model is mostly on the card. The speech-or-runtime process next to it is mostly in system RAM the GPU can see. A single “GPU memory” number cannot say that.
Why an Estimate Can Be Six Times the Measurement
The README records a second workload, also on an RTX 4080 SUPER. Docker Model Runner’s llama-server, using Vulkan, loaded gemma-3-270m. Raising the context flag from -c 4096 to -c 32768 made the tool estimate +504 MB of KV cache. Measured dedicated memory grew by +83 MB.
504 divided by 83 is about 6. Gemma 3 uses sliding-window attention (it only looks back a fixed window of recent tokens, not the entire context). The full-context formula is an upper bound, not a reservation you should expect to see filled. CUDA and Vulkan can also allocate lazily (they take the address space now and the physical memory on first use). Allocators keep freed memory cached, so a shrink can show up late. The README says to take the “after” snapshot once the model has answered one request, and to use gputaskman diff before.json after.json. A process that is missing from one snapshot shows as not listed, not as zero. Moves under 16 MB are hidden in the text diff and kept in the JSON.
That gap is the reason not to quote a KV estimate as “this is how much the card grew.” The tool is useful because it prints both numbers next to each other. A review that only prints the estimate is the thing the diff mode exists to correct.
How to Install gputaskman
You need a supported GPU and driver. Python 3.11 or newer if you install from PyPI. You do not need the CUDA toolkit, and you do not need an administrator shell for the source install. Windows portable builds are unsigned. Keep the _internal folder next to gputaskman.exe or the exe will not start.
From PyPI, with uv (a Python installer that keeps the tool in its own environment):
uv tool install gputaskman
gputaskman --onceOr pipx:
pipx install gputaskman
gputaskman --onceFrom a clone, which keeps the locked dependencies:
git clone https://github.com/shanselman/gputaskman.git
cd gputaskman
uv run --locked gputaskman --once
uv run --locked gputaskman --json--once prints one text snapshot and exits. --json prints one JSON snapshot, with null where a counter does not exist, so a Linux machine does not fake a Windows spill column. gputaskman diff before.json after.json compares two snapshots. --list-gpus and --gpu N pick a card. On WSL, --no-host skips the Windows host counters. The live UI keys are s to sort, a for top versus all, m for slim versus full, p to pause, ? for the explain overlay, q to quit.
Those commands were not run here. There is no GPU on this machine, so a successful-looking install would still have nothing honest to report. The commands above are the ones in the README, not a transcript of a live session on this machine.
Linux portable builds are gputaskman-VERSION-linux-x64.tar.gz and the arm64 twin. macOS is Apple Silicon, from a clone, and there is no portable build yet. macOS has no VRAM in the dedicated sense. Apple Silicon uses shared system memory. Without root you only see your own processes’ memory, and there is no 3D versus compute versus video split. If you wanted a VRAM pie chart on a Mac, this tool will disappoint you, and the README says so.
AMD on Windows has thinner telemetry: utilization, clocks, and power, with temperature and memory activity sometimes missing. AMD on Linux reads the amdgpu driver, and ROCm or HIP processes show GPU percent as n/a because of user-mode queues. Multi-GPU attribution is not fully validated. There is no NPU support. CPU-only and cloud workloads are out of scope.
When nvidia-smi Is the Right Tool
Use nvidia-smi when you are on Linux with an NVIDIA card and you only need the total and the process id.
nvidia-smi --query-compute-apps=pid,process_name,used_memory --format=csvThat lists compute processes and memory. It skips a pure graphics process, and it will not split a llama-server row into 604 MB of weights and 448 MB of cache. nvidia-smi pmon -s um adds per-process activity over time. On a shared Linux box, that is often enough, and it is already installed with the driver.
Switch to gputaskman when one of these is true:
- You are on Windows and
nvidia-smiprintsN/Afor per-process memory. - You are in WSL and
nvidia-smilists no processes. - Task Manager says the desktop or the browser is enormous and you need Local Usage instead of Dedicated Usage.
- You run llama.cpp, Ollama, or LM Studio and you want the context-sized KV estimate next to the measured allocation.
- You are about to raise
-cand you want a JSON diff, knowing the estimate can be several times the measured growth.
For cloud chips that are not a local card, see Maia 300 explained. Skip gputaskman when you have no local GPU, when you need texture names inside a game, or when you are on a Mac and the question was “how many GB of VRAM do I have.” The answer there is none, in the dedicated sense, and Activity Monitor’s memory pressure is a different page.
Common questions about gputaskman vs nvidia-smi
Does the KV Line Mean the Card Grew by That Much?
No. On the Qwen capture, the 448 MB estimate matched the allocated KV bar, at 4,096 context, with the slot idle. On the gemma capture, the estimate grew by 504 MB and the measured dedicated memory grew by 83 MB. Read both. The formula is an upper bound when the model uses a sliding window, and allocation can be lazy.
Can I Trust the Model Name?
Only at the evidence level the row prints. api plus mapped is confirmed. A file sitting in an install folder is not. A mapped GGUF does not by itself prove those weights are resident on the GPU or that they are the thing currently running. The README says that in one sentence, and the help screen repeats it by separating “which model file” from “weights / KV cache / compute split.”
Does This Replace Task Manager?
No. It does not kill processes, it does not manage startup apps, and it does not see NPU or CPU-only work. It answers a narrower question: of the GPU memory you can attribute, how much is the desktop, how much is the browser, how much spilled into RAM, and, for a GGUF runtime, how much of the model row is weights versus cache.
Worth installing the next time a local model is out of memory and Task Manager is pointing at dwm.exe. Not worth installing to replace nvidia-smi on a Linux box where the only question is which pid owns the card. If you are wiring a local agent board next, see Is Kanzo Worth It?. The repo is shanselman/gputaskman, the license is MIT, and the screenshots above are the ones shipped in docs/screenshots on that repo.
1 comment